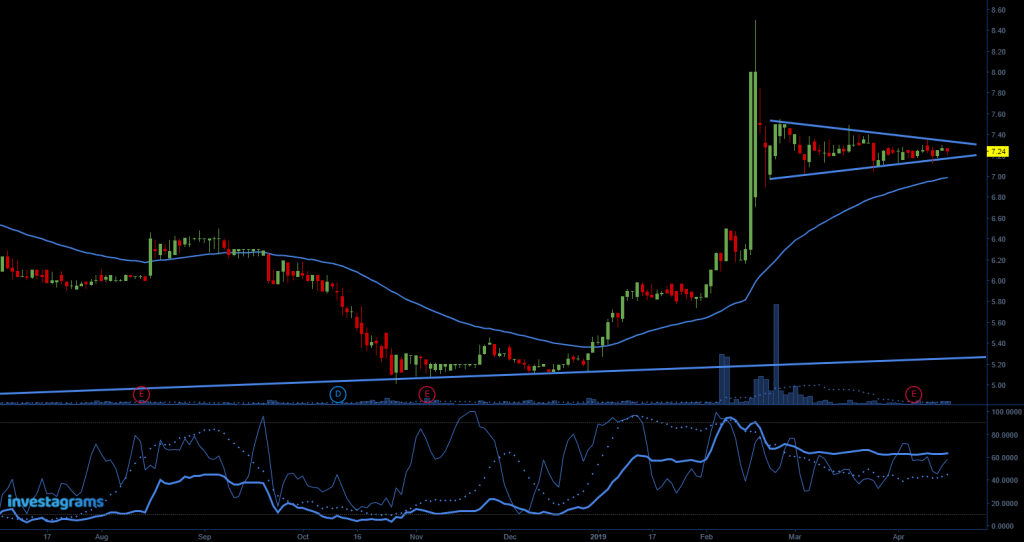
In daily chart above, we are seeing volatility contraction

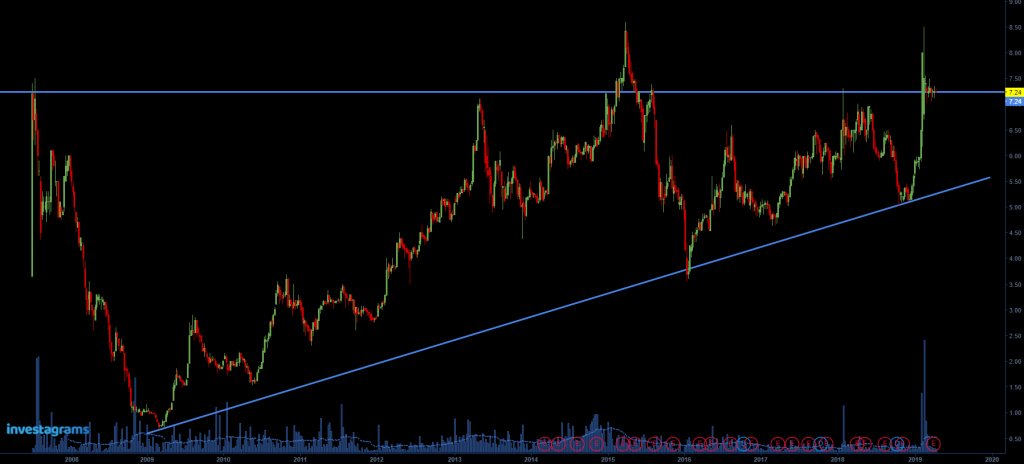
Zooming in to weekly chart, we can see that it is doing ascending triangle and we are at the resistance level.
VLL having a consistent annual earnings always 10% above.
- 2014 – 5.71B (12.78%)
- 2015 – 7.19B (14.33%)
- 2016 – 8.1B (12.71%)
- 2017 – 9.06B (11.88%)
- 2018 – 10.53B (16.24%)
